
NEXUS AI / WORKSPACE
Questions across every system, answered in plain language.
Workspace is where connected data goes to work. From the web portal, people reach and cross-reference information from any connected application, run queries, calculations, analyses and network studies, and build reports and dashboards — real time or static. What someone builds is theirs, and it is shared with named people or groups rather than exported.
Eight seconds, start to finish. Nothing to start, nothing to sit through.
The question is simple and the answer takes a week. Asset ages sit in one system, unit rates in another, work history in a third, and nobody owns all three. So it goes to whoever can write the query, joins a queue, comes back as a spreadsheet, and gets circulated after the meeting it was for. The next person who needs the same answer starts again, and ends up with a slightly different number.
-
Ask across systems
A question put from the web portal reaches every connected application at once. The person asking does not have to know which system holds which field.
-
Cross-reference where the data is
Information from different applications is brought together in one place, so the comparison is made against the live connections rather than against exported copies of them.
-
Run the work
Queries, calculations, analyses and network studies run against that connected data.
-
Build the view
Results become reports and dashboards, real time or static. What someone builds is unique to them.
-
Share it instead of exporting it
A report is shared with specific people or groups, and access rules travel with it — a reader sees what their profile allows and no more. Nothing leaves as an attachment that is stale the moment it is sent.
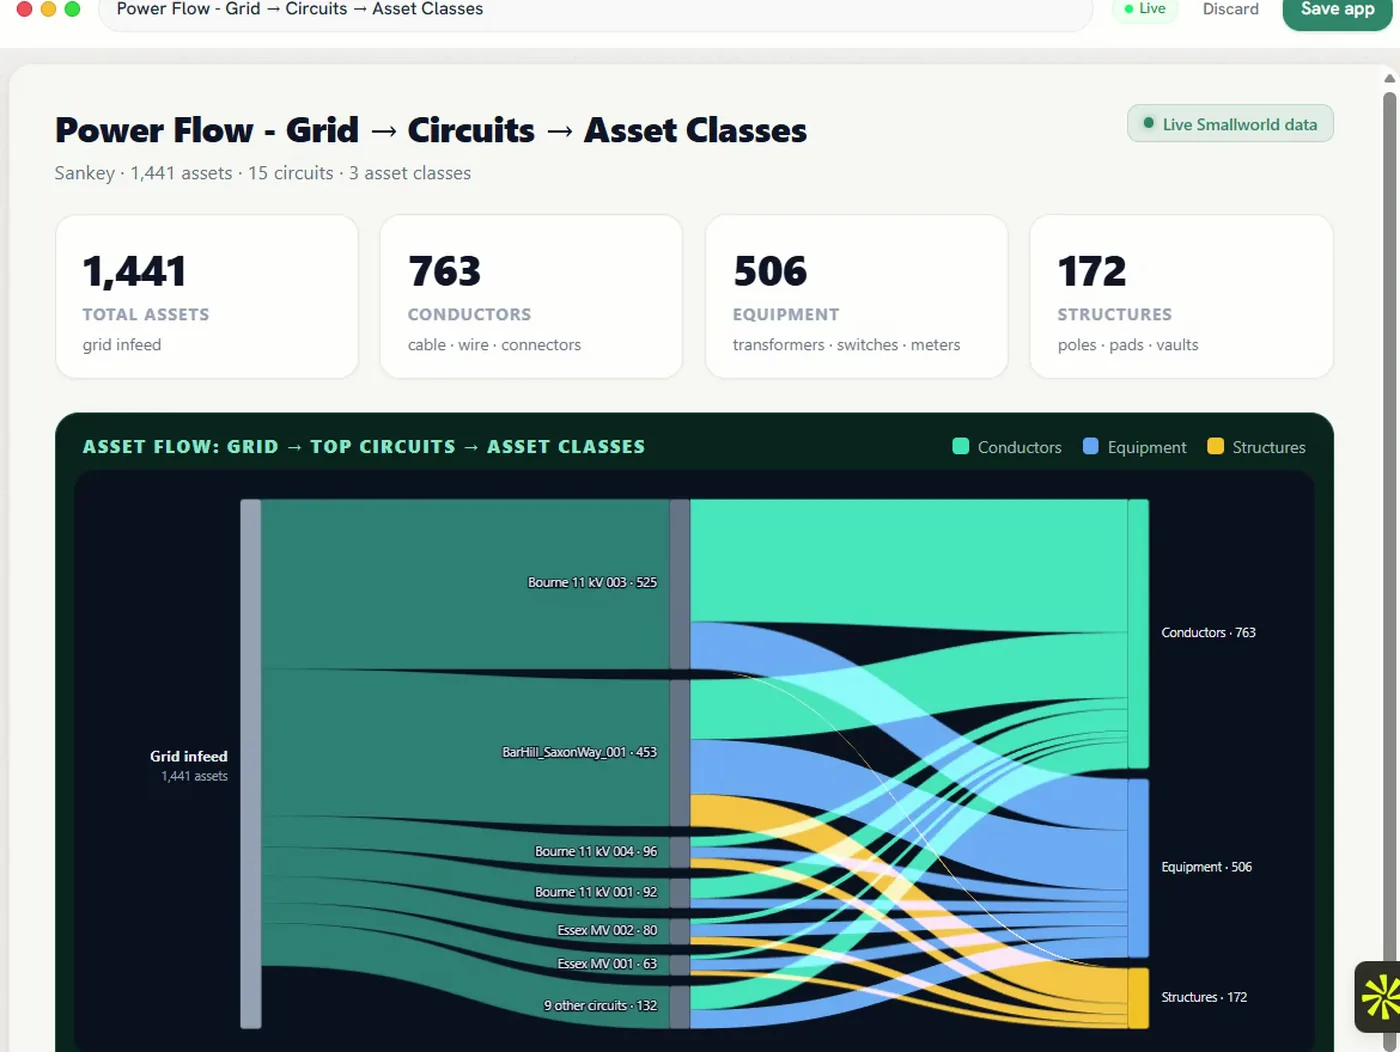
An indicator nobody can build today
Someone defines the measure they actually manage against, builds it once, and shares it with the group that needs it. No ticket, no export, and no second version living in a spreadsheet.
SAP rates against Smallworld asset ages
Replacement planning reconciled in one place rather than in a spreadsheet somebody rebuilds every budget season.
Where crews keep going back
Work orders read alongside the network model, so repeat visits show as a pattern on the same screen as the assets they belong to.
Each connection is made by API or by a direct database connection, and is defined once rather than per project.
- Any application connected through Gateway — Smallworld, SAP, Esri, 3GIS, maintenance systems
- Direction: Read
- ADMS
- Direction: Read only, from a non-operational copy
- Data already held on the platform
- Direction: Read
- The platform's own reports and dashboards
- Direction: Read and write
| System | Direction |
|---|---|
| Any application connected through Gateway — Smallworld, SAP, Esri, 3GIS, maintenance systems | Read |
| ADMS | Read only, from a non-operational copy |
| Data already held on the platform | Read |
| The platform's own reports and dashboards | Read and write |
Where it stops
- Workspace is where people ask and where results are consolidated. Acting inside a system of record is what the other pods do.
- It reports on what the platform can reach. To report across a system outside the platform, that system is connected first — which is what Gateway is for.
- A report shows what the reader's profile allows. Workspace enforces your rules; it does not decide them.
Who can see what
People sign in with the corporate directory account they already have, and what they are allowed to see is enforced in four places: at the platform, inside each pod, on the map, and in the answers that come back to them.
Where it stands
One figure, standing on its own rather than added to any other pod’s. Alongside it, cross-platform reporting cycles are designed to come down from days or weeks to minutes or hours.
Decision-making efficiency — The lift we aim for once a cross-system answer stops waiting on a reporting queue.
Technical walkthrough · 8 min
See it in action — watch the 8-minute Nexus AI Platform walkthrough.
Recorded directly in the platform, with English narration and no slide deck. GIS, ERP, ADMS, and maintenance answering together, without replacing the systems you already run. The link arrives after you register.
Need to brief your leadership? The one-page brief
A technical session covers your estate, where the platform would run, and which pods come first.
Book a technical session